|
|
|
|
|
|
|
|
Your guide to green living in Montgomery County, MD |

As the County pursues ambitious goals of 80% reduction in greenhouse gases (GHGs) by 2027 and zero emissions by 2035, we anxiously await updated greenhouse gas emissions inventories to help us monitor our progress.
The Metropolitan Washington Council of Governments (MWCOG) recently released the 2018 inventory and we take a look at the results below.

MWCOG has completed GHG inventories for Montgomery County’s community-wide emissions for 2005, 2012, 2015, and now 2018. The inventories measure GHG-emitting activities undertaken by residents, businesses, industry, and government located in Montgomery County, as well as emissions from visitors.
Emissions sources accounted for include:
Emissions sources not accounted for in the inventory include personal and embodied emissions, such as emissions generated during the manufacturing process of products outside of the county and purchased for consumption within the county.
For more details on the data collection process and methodology, refer to MWCOG’s factsheet.
The inventory helps the County to understand climate impacts and plan programs and policies to address those sectors. The 2018 inventory shows that buildings account for the greatest share of total County emissions – 50% come from electricity, natural gas, and other energy used in residential, commercial, and institutional buildings, including schools and government offices.
Transportation emissions from car, plane, and rail travel make up the next greatest share with 42% of total measured County emissions.
The rest comes from landfill and waste to energy emissions from trash and solid waste, wastewater treatment, agriculture, and other sources (including refrigerant emissions and fugitive emissions from natural gas pipelines).

Compared to 2005, emissions in 2018 had dropped by 19%. In the chart below you can see that the greatest drop was between 2005 and 2012. Between 2015 and 2018, total emissions decreased by 3%.
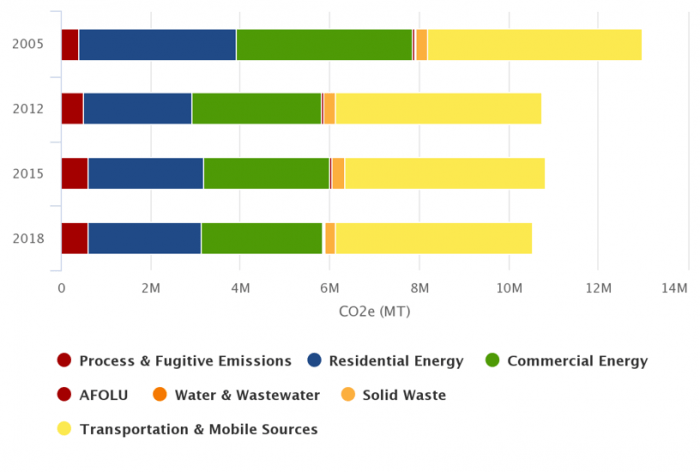
Electricity use in buildings is the main driver of the decrease. Electric emissions have been reduced through a combination of the electric grid cleaning up through replacement of coal with natural gas and addition of renewable electricity generation, an increase in on-site solar in buildings, and energy efficiency.
Between 2005 and 2018 all the non-building sectors – transportation, waste, wastewater, etc. – combined to reduce emissions by about 4% – around 230,000 metric tons of CO2e.
Over that same time period, residential buildings decreased emissions by 28% and commercial buildings decreased by 31% – a total of over 2.2 million metric tons of CO2e.
While the 19% reduction since 2005 puts us on the right path towards our zero emissions goal, we must greatly accelerate the progress. The County is working to finalize our Climate Action and Resilience Plan (CARP) which will provide a roadmap to achieving zero emissions and provide recommendations for adapting to a changing climate. We welcome the involvement of community members. Visit https://www.montgomerycountymd.gov/climate to learn more and pop into one of our Climate Planning Virtual Office Hours which take place each month.
|
|
© 2011 - 2024 My Green Montgomery |

Extinction Rebellion-MOCO told the climate truth about MOCO GHG with our protest outside the Marc Elrich’s office a couple of weeks ago when MAG first released the DC regional numbers. The truth is clear: both regionally and now in MOCO, there has been essentially NO DECLINE in GHG since 2012. The decline all came from 2005-2012. That decline most likely due to the Great Recession–and not from anything done by the County. Until we increase our pressure beyond polite meetings with County officials and emails, it is unlikely the County will do much better. Please join us.